Automatic Database Diagnostic Monitoring (ADDM) is one of the ways to use if you are facing performance problems with your database to gather information. Moreover, in previous releases the ADDM is generated based on 2 AWR (Automatic Workload Repository) Report snapshots which is taken on hourly basis and retained for 8 days by default. In oracle 12c, a new enhanced feature is introduced which is Real Time-ADDM. The real time ADDM is based on information fetched from memory triggered by manageability monitor process (MMON) especially when the database is in “hanging” state.
Database statistics gathering requires that STATISTICS_LEVEL parameter is set to TYPICAL or ALL. Also, check CONTROL_MANAGEMENT_PACK_ACCESS parameter.

Let us assume a scenario that your database is in “hanging” state:
sqlplus ‘/ as sysdba’ (if you can’t access then use: sqlplus -prelim “/as sysdba”)
SQL>@$ORACLE_HOME/rdbms/admin/rtaddmrpt.sql
SQL>exit
Now you have successfully generated a Real-Time ADDM, check it and see what is causing the problem (the file will be in HTML format).
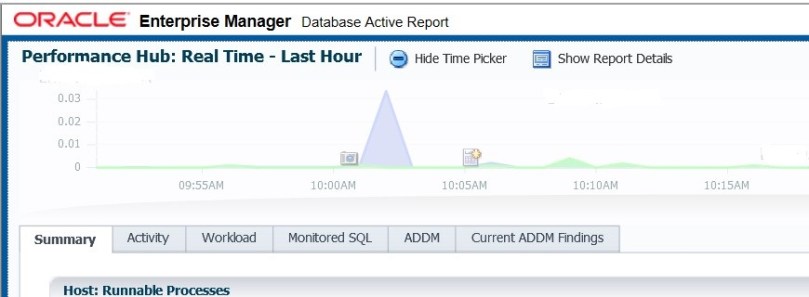
Another important report you can generated is “Performance Hub Active Report” which is a comprehensive HTML report that will show different tab information such as:
Activity
Workload
ADDM findings
Resources (CPU and Memory)
I/O
This can be generated using the following query:
SQL>@$ORACLE_HOME/rdbms/admin/perfhubrpt.sql